Designing automated experiences
CASE study: mixpanel
Outcome
Through this feature, we enabled customers ability to detect outliers within their data set in a timely manner, thereby saving them hours of time and effort.
The outcome to the business was a way to re-engage with infrequent users.
From a process perspective this project was a solid experience in cross functional collaboration and quick iterative learning cycles.

Background
Mixpanel is a product analytics tool that customers use to understand how their product features are performing. It is primarily designed to serve the needs of product leaders and data teams that are building technology solutions.
At Mixpanel I lead the design for their automated and predictive analytics tools. I collaborated closely with machine learning engineers and data scientists to present insightful data that customers might not discover on their own.
Mixpanel

Audience & Problem
On daily basis, product managers and analysts filter and segment their reports to understand what factors are having a positive or a negative impact on their core metrics.
“I don't want to see aggregate data, I want Mixpanel to show me insights”, product leader of a large media company.
Customers expect a level of intelligence from Mixpanel reports. They are looking for answers to the questions they are not even asking.
Approach
There were two key aspects to this project.
Identify parameters that are relevant and timely to the customers
Present this information to initiate further investigation.
I partnered closely with the machine learning team and some of our power users to define a framework that would help identify what is relevant.
How do we distill the signal from the noise?
CURRENT EXPERIENCE funnel segmentation

To analyze the cause of a spike in a metric or a funnel conversion, customers segment an event by its attributes (known as properties in Mixpanel). They can also segment it by device or any other custom properties they have implemented.
Within a data set on Mixpanel, customers can track anywhere between 50- 500 properties at one time.
In the gif above notice the number of properties in the dropdown.
Imagine, how time consuming it can be to go through each one of those properties and look at the data or one could just randomly guess what might be causing the spike! Not a very effective way to analyze data 😠
MILESTONES

what is insightful?
The machine learning model would analyze all the segments within a project to find segments that are affecting performance.
However, the model is not personalized to know the contextual relevance of a particular segment. For any given task, the model can have over 80 segments to provide overwhelming experience for the users.
How do we determine what is insightful across all the different companies that use Mixpanel ?
framework to define insights
I aligned the parameters in models output to customers goals to come up with a framework that would help us rank and filter the results.
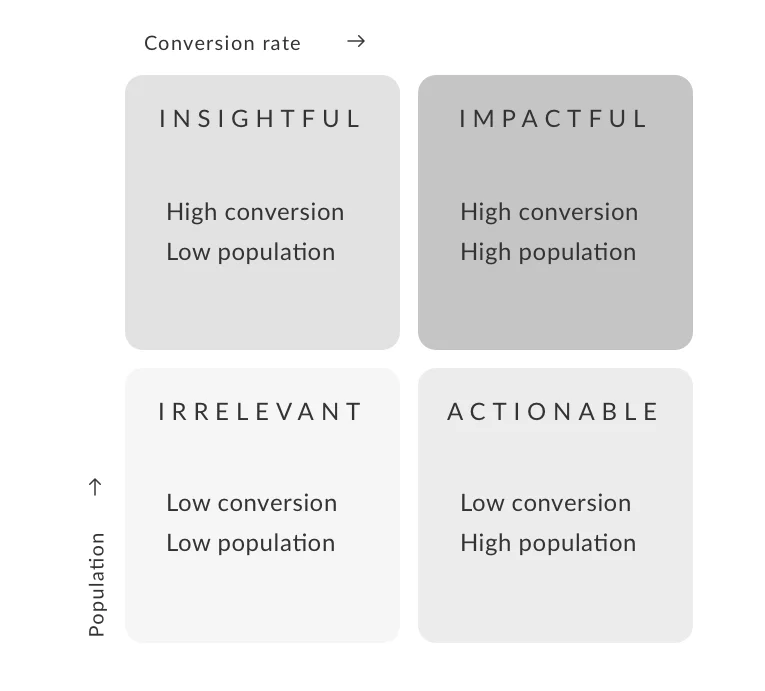
A deep dive into the aspects of decision making applied by our power users and internal product managers, I developed this framework to help the machine learning team filter out the signal from the noise.
closed beta : funnel analysis
For the first iteration we wanted to test if the insights were actually valuable for the customers.
We designed a light weight CTA that was integrated in one of our top reports and the results were sent to customers via email.
This feature provides customers an ability to get the top and worst converting property segments for a funnel, automatically across all of their event properties and cohorts.
This saves them time spent on clicking through multiple segment breakdowns so they can focus more time on taking action on their insights.
Our goal was to learn if customers found the content in the emails insightful and relevant.
end - end customer journey : v1
This solution was designed to be lightweight. Our strategy was to test the algorithm and avoid cluttering the core experience until we were confident in the value of the automated insights.
What we learned?
Closed Beta: Are the results insightful?
The 1:1 customer interviews with closed beta participants revealed three major themes:
Users found the number of results in the email noisy. They were looking for signals, not a data dump.
Users glanced at the first two or three rows to see if reading further was worth their time. The channel of delivery i.e email had an impact on the way they reviewed the results. Most users open the email on their phone
Relative comparison calculations would be helpful to get a signal on impact.
NEXT STEPS
Based on the feedback from closed beta studies, we had two action items:
Improve the filtering and ranking of results to be more relevant.
Optimize the email experience for mobile
To address the needs of diverse products and their unique Mixpanel implementation, we did a human QA exercise to ensure that the results were insightful. This would inform the filtering and the ranking of the machine learning model.
The purpose was to find meaning in the numbers without knowing the context.

Design principles
Is it impactful, sharable and actionable?

To really understand how we could further narrow the results, we generated insights from a couple of anonymous data sets and voted if its was important. Each member of the team gave their vote since we would each have a different perspective on what is important.
This really helped us identify the patterns at a higher level without having a lot of context.
OPEN BETA - OPTIMIZE FOR EMAIL ENGAGEMENT
To make sure we were not losing customers in the email process, we optimized the email designs to ensure that more customers were clicking through and looking at the data in the email.
Mobile first email design
Personalize subject line
Design table layout for glance and scroll behavior
mobile optimized email results
Impact

What I Learned?
Automation is a decision making process. When making decisions on behalf of others, its important to win trust .
User behavior is greatly influenced by delivery channel.
Qualitative and quantitative research in tandem enables quick iterations.
Next Steps
To win customers trust, I would design to engage them in the decision making process of identifying what’s important. My hypotheses is that people don’t like decisions being made for them, however if they are invited to participate in the process they are more likely to buy into the decision. 🤓