Designing for continuity
CASE study: mixpanel
Outcome
The designed solution increased customer efficiency for a frequent task by a 100% by reducing context switching and repetitive inputs. Strategically it led the way for a universal interaction paradigm.
Background
Mixpanel is a product analytics tool that customers use to understand how their product features are performing. It is primarily designed to serve the needs of product leaders and data teams that are building technology solutions. The motivation to use Mixpanel is to understand user behavior and analyze product performance to inform business decisions.
Mixpanel
Audience & Problem
On Mixpanel users create different types of reports based on the questions they are looking to answer. For eg: To learn how many people are converting through a specific flow, one would look at a funnel report. To group users by behaviors one could create a cohort.
How does a product manager capture a cohort of users that didn’t complete a specific step in a funnel?
Disconnected reports lead to a frustrating error-prone workflow for the end user.
The challenge was to create a bridge that connects different Mixpanel reports to allow for continuity, that is natural to the investigative nature of data analysis.
Approach
HOW DO PRODUCT MANAGERS CURRENTLY ACHIEVE THIER GOAL?
When analyzing a funnel, product managers are looking to find ways to improve their funnel conversion. One of the ways they do that is by building a cohort of users that converted/didn’t convert in a particular funnel and then re-targeting those users.
CURRENT EXPERIENCE creating a cohort from funnel analysis
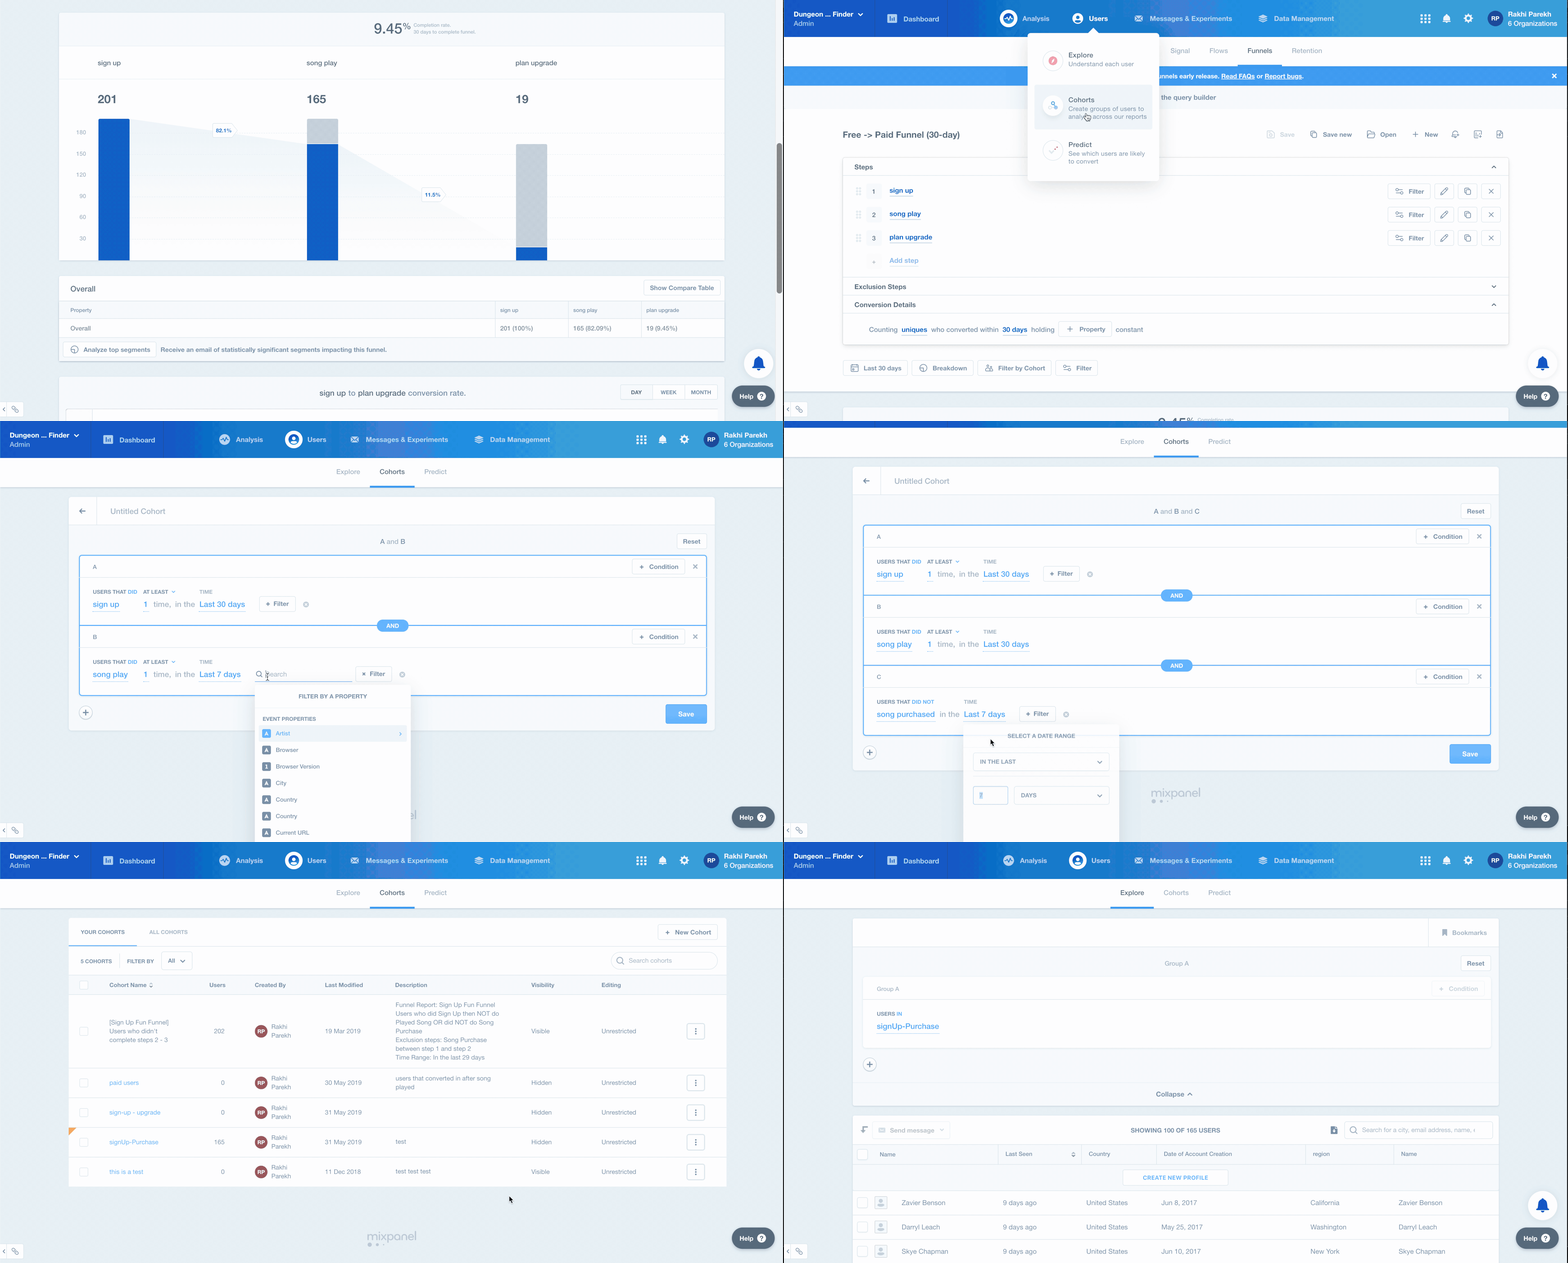
The gif above shows the typical process of analyzing the performance of a funnel. Customer’s goal is to identify the users that dropped off between step 2 and step 3 in the funnel
Notice how the customer has to switch from Funnel tab in the Analysis menu to the Cohort tab under the User’s menu, recreate the query of the funnel and then get to the data they are looking for. The customers experiences frustration from context switching and feels nervous about making a mistake in rewriting the query parameters.
Now imagine, having to do this for multiple funnels! 😫
PAIN POINTS
MEETING PEOPLE WHERE THEY ARE
To design an interactive bridge that would connect reports across Mixpanel, I needed to understand how people interact with the reports.
I mapped out the usage patterns for the reports. This exercise gave me a quantitative understanding of which were the top interactions of the report and what were the characteristics of the data analyzed in the report.
Based on the behavioral understanding, I designed 3 concepts and tested them with Mixpanel users in 1:1 interviews. 10 participants were shown three prototypes each. Through this study I found that majority of the participants had a natural instinct to click on the chart if they wanted to take action to learn more.
MAPPING INTERACTION PATTERNS OF THE FUNNELS REPORT
CHARACTERISTICS OF A TYPICAL FUNNEL REPORT
Solution
A universal contextual action menu that enables users to take action on insights. This menu can be triggered across all Mixpanel reports. The UI language of the contextual menu is scalable across the platform.
Design Principles
UNIVERSAL CONTEXTUAL MENU IN FUNNELS REPORT
This gif shows the v1 version of the contextual menu that was built and tested on a segmented cohort of funnel users.
Note how the customer is able to interact with the data visualization to select the cohort by behavior and name the cohort of users.
This solution doesn’t require the customer to go to a different tab, or rewire the query. It also gives a way for them to capture user from multiple steps.
UNIVERSAL CONTEXTUAL action MENU IN RETENTION REPORT
The universal contextual action menu was implemented in the retention report as well.
The scalability aspect of the solution afforded the design and development team to move really fast when implementing this feature across the end-end experience. ✨
Impact
Next Steps
Taking this idea of continuity further, I would like to explore the concept of a layered experience that enables the customers to zoom-in and zoom out into the data without context switching. My hypotheses is that the layered experience would mirror the nature of cognitive process of investigating patterns within information.


